
Sharing insights into the development of absenteeism. That matters more.
Absenteeism in figures
To provide employers and policy-makers with more insight into absenteeism, we publish the latest absenteeism figures and developments in the Netherlands on a regular basis. In addition to these national figures, you will also find a further breakdown of these figures by industry and company size, as well as the most important annual trends in absenteeism over the past four years.
Take a quick look at our latest quarterly industry figures (absenteeism rate, number of sick reports) or check out the annual trends in absenteeism (absenteeism rate & frequency of reporting in sick, duration of sick leave, reasons for absenteeism).
Absenteeism figures, 1st quarter of 2024
Absenteeism rate by industry and company size
This table shows the average net absenteeism rate for the past 3 months for the largest industries, both nationwide and broken down by the wholesale market and SMEs. The average absenteeism rate is an important absence figure. It indicates the percentage of working time lost due to sick leave.

Number of reports of sick days by industry and company size
Another important absenteeism figure is the number of reports of sick days. This table shows the number of reports of sick days per month per 1,000 employees over the past three months, both nationwide and broken down by the large business market and SMEs.

Annual trends in absenteeism | sick leave
Absenteeism rate
This chart shows the trend in the average net absenteeism rate in the Netherlands over the past 4 years, including a breakdown by company size. By 2023, this absenteeism rate had fallen slightly to 4.6% nationwide. The general picture is that companies in the large business market have higher absenteeism rates than SMEs. There may be differences at the individual company level, however.

Frequency of sick reports
This graph shows the development of the average frequency for sick reports in the Netherlands over the past four years, including a breakdown by company size. The frequency of sick reports indicates the average number of times an employee reported sick per year. After rising sharply in 2022, the frequency of sick reports fell to 0.71 in 2023. The general picture is that employees of companies in the wholesale market are more likely to report sick than those in SMEs. There may be differences at the individual company level, however.

The overall picture is that, relatively speaking, long sick leave only accounts for a small proportion of the total number of absence notifications, but are responsible for most of the total number of sick days. In 2023, the number of notifications of long-term absence rose slightly to 10.1%. The long-term absenteeism rate rose to 78.7%.
Share of absence notifications by duration category
This graph shows the trend in the number of absence notifications by duration category in the Netherlands over the past four years.
Share of absenteeism by duration category
This graph shows the trend in the proportion of absenteeism by duration category in the Netherlands over the past four years.


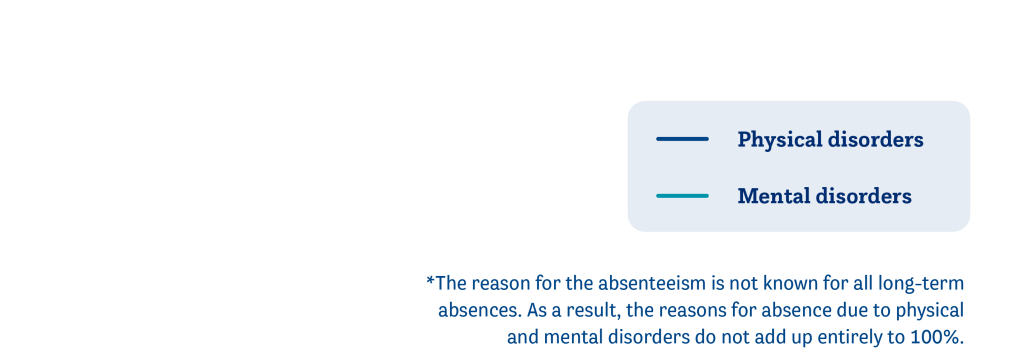
Share of long-term absenteeism rate by reason for absence
This graph shows the development of the reason for long-term absence in the Netherlands, as a share of the total net long-term absenteeism rate*. The trend of increasing psychological absenteeism continues. By 2023, the proportion of psychological absenteeism rose to 40.2%.

The reported figures are based on the absenteeism figures from HumanCapitalCare and ArboNed, both part of HumanTotalCare . With more than 64,000 employers, together we care for approximately 1 million healthy, motivated and competent employees.
Stay informed?
View our news page for the most current reporting on absenteeism in the Netherlands